Overview
Server logs is a read-only page under Management that lists the errors and warnings the ToBeAlert server writes, newest first. Use it to find out why something failed without opening a shell in the server container.
| Step | What you do | Where |
|---|---|---|
| 1 | Choose which log to read | Log selector |
| 2 | Choose the lowest severity to show | Minimum level selector |
| 3 | Narrow the list by text, logger, or request id | Search text, logger or request id box |
| 4 | Open an entry to read the full message and copy it | Expand arrow at the start of a row, then Copy |
| 5 | Go further back in time | Load older entries |
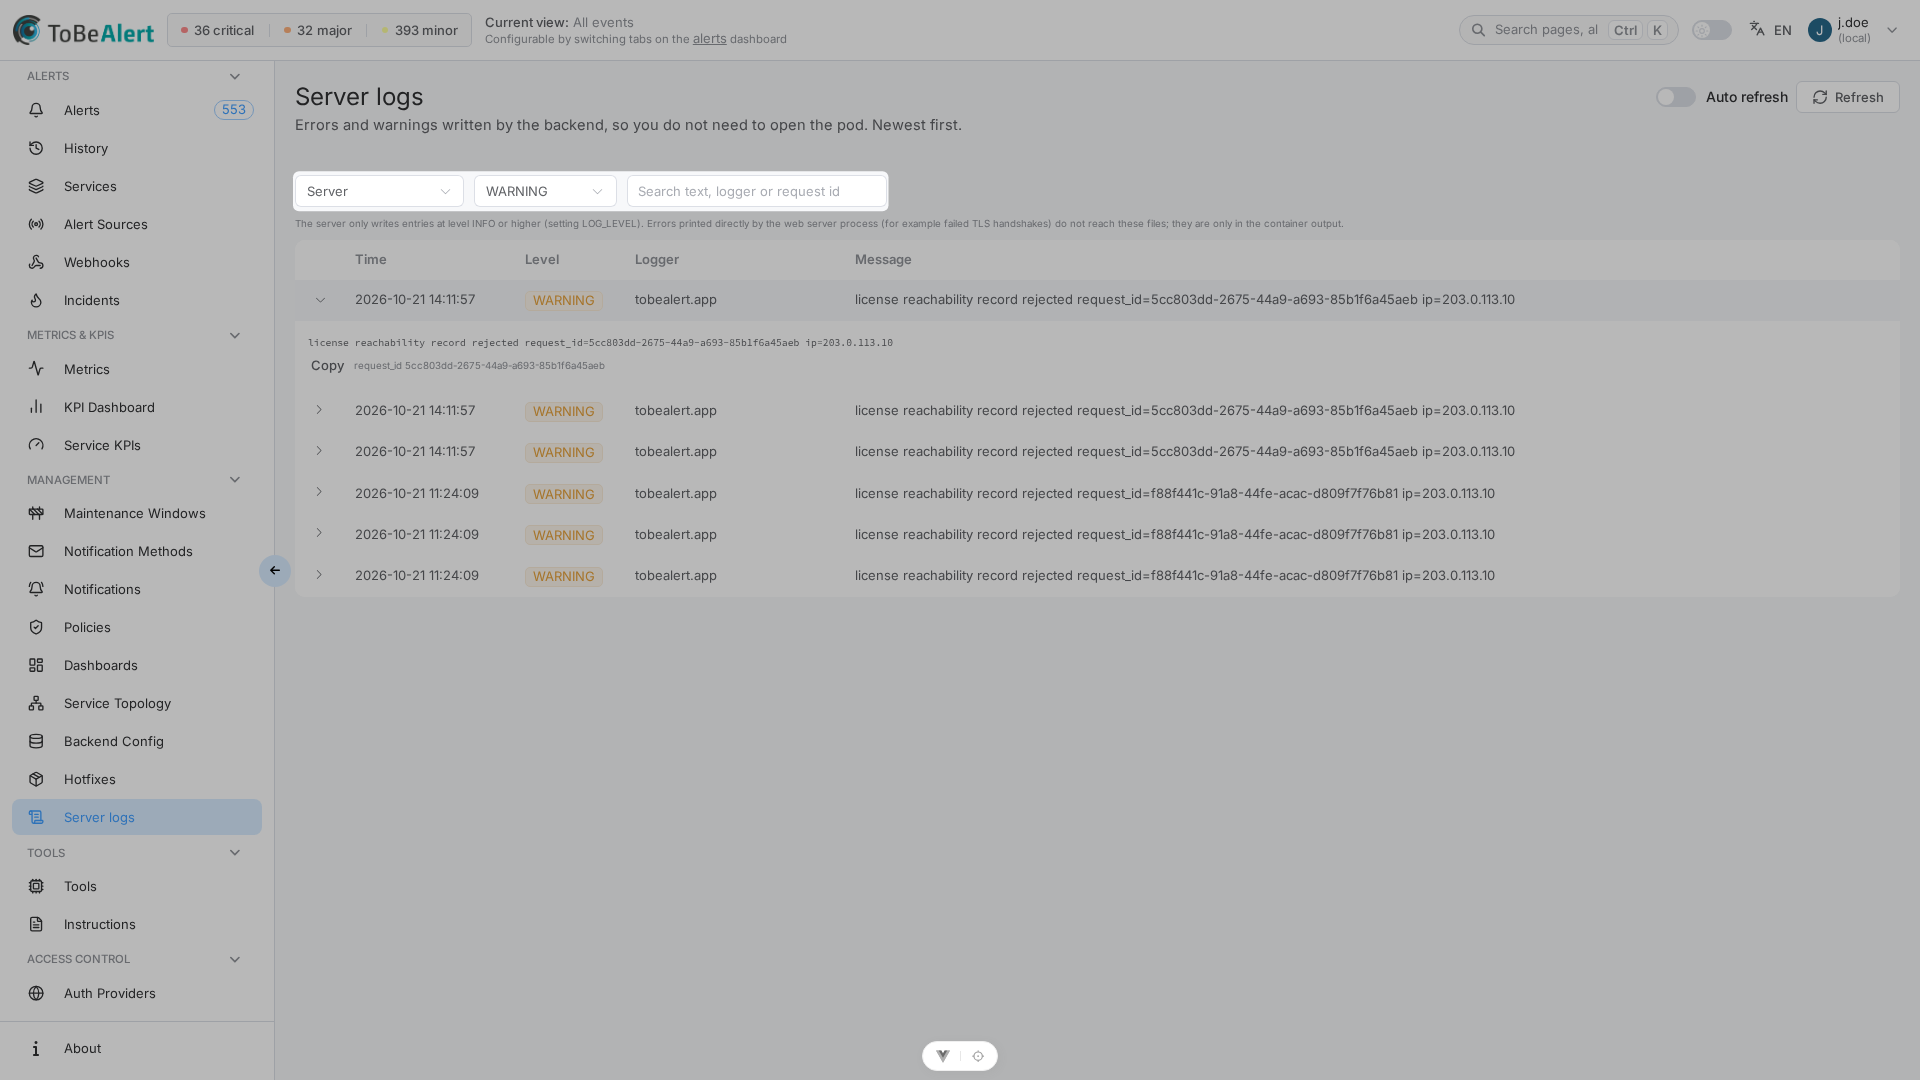
Where to find it in the UI
In the sidebar under Management, choose Server logs — /server-logs.
The page opens for users with the read:server_logs permission. Roles that already had admin:management keep access, so existing administrators see the item without any change. The generic read and write (the built-in user role) do not open it. Without access the page shows Access denied. Admin privileges required. See Permissions reference — Management.
The page
The header has an Auto refresh switch and a Refresh button. Under it are the filters, and below them the table.
| Control | Description |
|---|---|
| Log | Server, Background tasks, Plugins, or Notifications. Server is the default |
| Minimum level | DEBUG, INFO, WARNING, ERROR, or CRITICAL. Entries of that level and above are shown. The default is WARNING |
| Time | All time (default), the last 15 minutes, hour, 6 hours, 24 hours or 7 days, or a Custom range with a start and an end. Entries and ranges use the server time, shown under the filters |
| Search text, logger or request id | Finds entries whose message or logger name contains the text, ignoring letter case. A request id copied from an error message works too. The list updates shortly after you stop typing |
| Auto refresh | Reloads the list every 15 seconds while the switch is on. It is off when you open the page |
| Refresh | Reloads the list now |
Table columns
| Column | Description |
|---|---|
| Expand arrow | Opens the full message below the row |
| Time | Date and time of the entry |
| Level | Colored tag: DEBUG and INFO gray, WARNING orange, ERROR and CRITICAL red |
| Logger | The part of the server that wrote the entry |
| Message | First line of the message. Hover a long logger name to read it in full |
When there is nothing to show, the table says No entries at this level.
Read and copy an entry
- Click the arrow at the start of a row.
- Read the full message, including tracebacks. If the entry carries a request id, it is printed next to Copy.
- Click Copy to put the time, level, logger, and full message on your clipboard, ready to paste into a support request. A Copied message confirms it.
If your browser does not allow clipboard access (for example on a plain http address), Copy does nothing; select the text in the expanded message instead.
Load older entries
The list loads 100 entries at a time. When there are more, Load older entries appears below the table and adds the next older block.
Limits you should know
A line under the filters tells you the level the server is set to write, for example The server only writes entries at level WARNING or higher (setting LOG_LEVEL). Keep these limits in mind:
- Only what the server writes. If the server is set to write WARNING and above, choosing DEBUG in the page cannot show anything that was never written. To see more detail, lower the
LOG_LEVELsetting in the settings file (for example toINFO) and reproduce the problem. - Some errors never reach these logs. Errors printed directly by the web server process (for example failed TLS handshakes) appear only in the container output, as the note on the page says.
- Recent history only. For each log, the page reads the most recent part of the file (up to 8 MB), so very old entries may be gone. A request returns at most 500 entries.
- Very long messages are shortened. A message over 20,000 characters is cut and ends with (truncated).
- A log can be missing. If a log file does not exist yet, the page shows This log file does not exist yet. This is normal for a log nothing has written to.
- Read-only. The page cannot clear, download, or change logs.
If the logs cannot be read, a red banner says Could not load the logs. Use Refresh to try again.
Scenario: a notification did not arrive
- Open Management → Server logs.
- Set Log to Notifications and leave Minimum level on WARNING.
- Switch on Auto refresh, then trigger the notification again.
- Expand the new entry to read the error, and click Copy if you need to send it to support.
Related
- Diagnostics — timed probes for slow deployments
- Settings file — the
LOG_LEVELsetting - Hotfixes — the other page that opens with its own permission
- Permissions reference
Best practices
- Start at WARNING and lower the level only when you need more context.
- Search by request id to follow a single failing request across entries.
- Switch on Auto refresh only while you reproduce a problem, and switch it off afterwards.
- Give support the copied entry, not a screenshot, so the traceback stays searchable.
- Give the permission to the people who triage problems instead of the whole management permission.